

Update (3rd Nov 2020): Google have released a product, Google Analytics 4. While it is now the default new installation, Universal Analytics will still continue to be used by most businesses. Many aspects of Google Analytics Users will be similar in both platforms but there are some marked differences. For now, this post focuses on Universal Analytics but it will be updated as Google Analytics 4 grows in maturity and popularity.
—————
Google Analytics Users is one of the key reporting metrics of Google Analytics. But how does this data actually relate to the visitors who came to your site? Which reports can tell you more about your website Users and how to read this data to improve your online KPIs?
Google Analytics can be used to improve your business profitability. If you’re a beginner or an intermediate user of Google Analytics, this article will help you answer the questions above and set you on the way to get better insights out of your data. It’s particularly aimed at entrepreneurs and marketers who want to understand the business value in User-based reporting in Google Analytics.
As someone who’s trained hundreds of people in Google Analytics and implemented and drawn insight from many companies’ tracking set-ups, I know the questions you are eager to get answers to.
By the end of this post you’ll know:
- how Users data is collected,
- which reports and attributes can help you find out more about your website visitors,
- and how to interpret the data to improve your website and make smarter marketing budget decisions.
Let’s dive in.
The definition of Google Analytics Users
Before we get to the juicy bits, let’s start with the basics.
Google’s definition of a User is this: “In order for Google Analytics to determine which traffic belongs to which User, a unique identifier associated with each User is sent with each hit.”
In broad terms, “Users” are the total number of new and returning visitors that get to your site. The numbers you see in reports are always related to the timeframe that you specify.

The first time someone visits your site, Google Analytics assigns a cookie with a unique identifier to a User. This identifies them as a “New User”. If the same user returns to your site, they will then be classed as a “Returning Visitor”.
I’ll get into the specifics of New vs Returning Users further into the article.
How are Google Analytics Users tracked?
When you install Google Analytics tracking on your website, Users are recorded automatically. The information about each User is stored as a cookie on the browser of each person that comes to your website. That cookie includes the Client ID – and this is how Google Analytics recognises your visitors.

A unique Client ID identifier is assigned when a person visits your site for the very first time. Client ID is a combination of a random number together with the timestamp of when the visitor had their first interaction with your site.
And with the short technical introduction out of the way, keep reading to see how it all relates to your actual visitors.
The difference between Google Analytics and actual visitors to your site
I mentioned before that Google Analytics adds the Client ID information to the browser that was used to visit your site. Therefore, Google Analytics is recognising browser instances – not identifying actual people.
Let’s consider an example:
- A person accesses a site from their office computer. Google Analytics places a cookie on their browser and assigns them a Client ID. They are now a New User.
- They return home and once again access the same site, this time from their iPad. Google Analytics will see them as a New User again and it will place a cookie on their iPad, assigning a new Client ID.
- If that same person then goes back to work and goes to the same website again, but using a different browser, a third Client ID will be created for them, yet again classing them as a New User.
- To make things even more interesting, if they decide to clear their cookies or open an incognito tab, Google Analytics will have to create a new cookie one more time, assigning a new Client ID and generating another New User.
In this example above, it’s the same person visiting your website four times, but in your Google Analytics reports, you will see four different Users.
To sum up, whenever a visitor to your site uses a new device, browser or when they clear their cookies, Google Analytics will not be able to tell that they are the same person.

It’s something that’s important to be aware of when analysing your reports. For instance, you might not necessarily be able to tell if visitors to your site are using both mobile and desktop devices.
Having said that, there are ways to mitigate that, but that requires extra implementation effort. More on that later on in this post.
Google Analytics New vs. Returning Users

I’ve just explained how Google Analytics identifies New Users whenever a visitor first comes to your site and a new Google Analytics cookie is created.
Should they visit the site again, Google Analytics would see them as a Returning Visitor.
This simply means that Returning Visitors came to your site again, using the same browser.
Google Analytics Users vs. Sessions
A Session represents each individual site visit by a User.
A User can come back to the same website hours or days later and begin a new Session. This means that one User can have multiple Sessions. So, the same User visiting your site 50 times from the same device is counted by Google Analytics as one User and as 50 Sessions.
Bust what does it take for a Session to be restarted as a new one?
A Session begins immediately after the first page loads for a User. It ends after 30 minutes of zero activity or at midnight. For example, if a User opens one of your webpages but then leaves the computer for 40 minutes and returns to the same page, they will be counted as two Sessions and one User. In the same way, if a User loads your page at 11.45 pm and leaves your page at 12.05 am, that’s also two Sessions and one User.
In Google Analytics, you can find out how many Sessions Users have on average. The metric is called “Number of Sessions per User” and one way to check it is in the Audience Overview report.
If the number is close to one, it could suggest that many visitors are not engaging with your site and leaving too quickly. If the number is exceptionally large, like 7 or more, it could mean your users are getting lost in your site and can’t get to the information they need.
All this will depend on your website architecture, type of content and goals – so use the number as a starting point for deeper investigations.

Google Analytics Users vs. Pageviews
Pageviews will tell you how many times a page was loaded on your website – this is regardless of the number of Sessions it was done over or of the number of Users that triggered these views. The metric shows the total number of views overall and per page – depending on which report you look at.
It can mean that a single visitor could be responsible for hundreds of Pageviews, or that a single page could be viewed many times in a Session.
The number of Pageviews is sometimes used as a KPI – but for most situations, you’d want to keep track of the number of Users instead. This is much more symptomatic of how many people visited your site and whether they converted.
Pageviews are a much better indicator of how your site visitors interacted with your website. You’d want to monitor any changes to it as a prompt for further research – but not necessarily to aim for any specific number.
The top User-based reports in Google Analytics and how to use them
If you’re excited to get hands-on with a User-based report, you should give the standard reports a go first. There is plenty of helpful info to capture and feed into your marketing decisions.
I’ll dive a little deeper into some of the standard reports available in Google Analytics and suggest ways to use them. My list will include suggestions for utilising the most widely-used reports as well as suggesting ways to analyse the less popular charts that provide much hidden value.
How to use the Audience Overview report in Google Analytics?

The Audience Overview report provides you at-a-glance, main performance data for your website. Within the report, you will find some key Metrics that can feed into your website KPI report.
The timeline available in the report allows you to assess the health of your website: by adjusting the dates, you can quickly spot trends like:
- whether your traffic is going up or down,
- if there any noticeable weekly trends in visitor numbers,
- whether your website falls into seasonal trends that relate to your specific market.
If your account is well managed, you’ll see annotations next to any possible outliers that can explain unexpected movements. If the trends you’re seeing are not easily explained by known internal or external factors, it’s important to investigate the causes.
Under the timeline, you should also pay attention to the Metric widgets:
- Users: The unique number of individuals that visited your website (providing they used the same device and browser). This is likely to be one of your KPIs.
- New Users: The unique number of individuals new to your website (these numbers can be inaccurate if your Users clear their cookies). Compare this number to Users to find out how likely people are to revisit your site. Use date comparisons to see trends before and after important events (e.g. launching a new marketing campaign or adding new content).
- Sessions: The number of visits in which your User was active on your site without a 30 minute period of inactivity.
- Page Views: The number of page loads (includes multiple visits to the same page by the same visitor).
- Pages/Sessions: The average number of pages each User viewed per Session.
- Average Session Duration: The average time a visitor spent on your site during each session (account for the fact that Google Analytics has a different way of calculating this value to what you may expect).
- Bounce Rate: Refers to visitors who only visit one page of your site and then leave before interacting with it further (this should only be used as a broad indicator, as you’re looking at your site’s Bounce Rate in total, rather than for individual pages).
In addition to monitoring the general health of your website, you can also apply helpful Segments to drill down into the Audience Overview report. You could compare desktop to mobile traffic or visitors from different countries. This way, you may spot considerable variations that could highlight friction areas you’d like to address.
How to leverage Demographics reports in Google Analytics

A basic principle of all websites is that you bring the “right” visitors to your site. This is where demographics are invaluable.
A vast majority of internet users have Google accounts of one form or another, which makes it easy for Google to compile information on visitors to your site.
Analytics reports can show data such as:
- Age – broken down into seven age ranges,
- Gender,
- Interests,
- and even buying preferences.
Google compiles so much data from Gmail, app messages, browsing habits and videos watched on YouTube that they can infer your Users’ personal interests. While these are broad categories, you can gain some level of understanding of what your visitors find interesting:
- Affinity Categories – wide interests in terms of the content they consume online,
- In-Market Segments – categories of things people are looking to buy,
- Other Categories – this takes a deeper dive into affinity categories.
Access Demographic reports, available under Audience group of pages in Google Analytics, to find out more about your Users. Use Segments to determine how different groups of Users differ in their behaviour.
How to use Cohort Analysis in Google Analytics?

Cohort Analysis is another report that is part of the Audience group of reports in Google Analytics.
To understand how Cohort Analysis works, let’s define what a cohort is:
In simple terms, a cohort is a “group of people with a shared characteristic”. In Google Analytics terms, it’s groups of visitors interacting with your site within a specific date or date range. The Cohort Analysis report allows you to analyse their behaviour.
If you make changes to your website or launch new marketing campaigns, Cohort Analysis will tell you the impact of these changes on whether the Users returned to your website or how long they took to make a purchase, compared to Users who saw your website before the changes.
All you need to do is adjust your date ranges and toggle the Metric to reflect your key website goals.
How to use the Active Users report in Google Analytics?

Also in the Audience menu, you will find the Active Users report.
An Active User is a Unique User who initiated sessions within the given time period of your selected date range. You can break the report down into 1, 7, 14 and 30-day Active Users.
The chart is useful if you want to interpret the performance of any campaigns that you have running in terms of visitors coming back to your site. For instance, you could compare the 1-day Active User trend line to those based around 7, 14 and 30-day Active Users.
Find out the impact your different marketing activities have on your retention levels by looking at how close these lines are together and applying segments based on different campaigns.
Can you calculate User Lifetime Value with Google Analytics?

If your business model relies on entry pricing to get your foot in the door, lifetime value will be a better indicator of how well your website is performing rather than to simply count sales.
Google Analytics’s Lifetime Value (LTV) is based on 90 days. Which, even though is not by any stretch a lifetime, is still a handy period to assess the behaviour of customers over a stretch of time when you want to compare different marketing channels.
In the Lifetime Value report (available under Audience), the following metrics are available to asses:
- Goal Completions per User
- Pageviews per User
- Revenue per User
- Session Duration per User
- Sessions per User
- Transactions per User
You can then compare these by marketing Channel, Source, Medium or Campaign.
To get a long-term view of how well your marketing efforts are performing, check out this handy report.
How to analyse User Attribution in Google Analytics

Attribution with Google Analytics means deep diving into customer acquisition channels.
While Acquisition reports allow you to check how Users got to your website based on each individual visit, with Attribution Modelling you can tell how different channels worked together to convert your Users into leads and customers.
Access the Multi-Channel Funnels series of reports under Conversions.
If you have your goals or Ecommerce tracking set up correctly, you’ll be able to tell how different channels assisted one another into converting your Users over multiple Sessions. E.g. you will often see many conversions attributed to the Direct channel, but it’s not a channel you can actually invest in. Instead, you can discover which other channels were visited earlier by Converters, and you can invest your money accordingly.
A simple way to get started with Attribution is by checking the Assisted Conversions report. Find out which channels were visited by converting Users but that didn’t directly result in a conversion. These are the channels you should start paying closer attention to.
What are User-scope Metrics and Dimensions?
Google Analytics makes it easy to analyse and combine different pieces of data together by giving them a common scope. Where it can get difficult for some is that not many beginner and intermediate users of the tool know about this trick.
The reason that the trick is little known is that you’ll never need it when using any of the standard reports, which is what most people use. It only becomes useful when customising these reports.
User-scope is one of the scopes defined in Google Analytics – and as such it provides a framework for combining data in custom reports to analyse together successfully.
If you’ve ever created a Custom Report in Google Analytics, only to get empty data or data that didn’t make sense, chances are you were trying to combine Metrics and Dimensions from different scopes together. Anomalies like this may happen if you want to report on, e.g. Pages (Hit-scope Dimension) and Goal Completions (Session-scope Metric) together.
Creating Custom Reports, Segments or adding Secondary Dimensions in Google Analytics are all great ways of finding more insight. If you want to learn more about your Users, make sure you combine them together effectively, based on the right scope.
Examples of User-scope metrics are: Users or New Users.
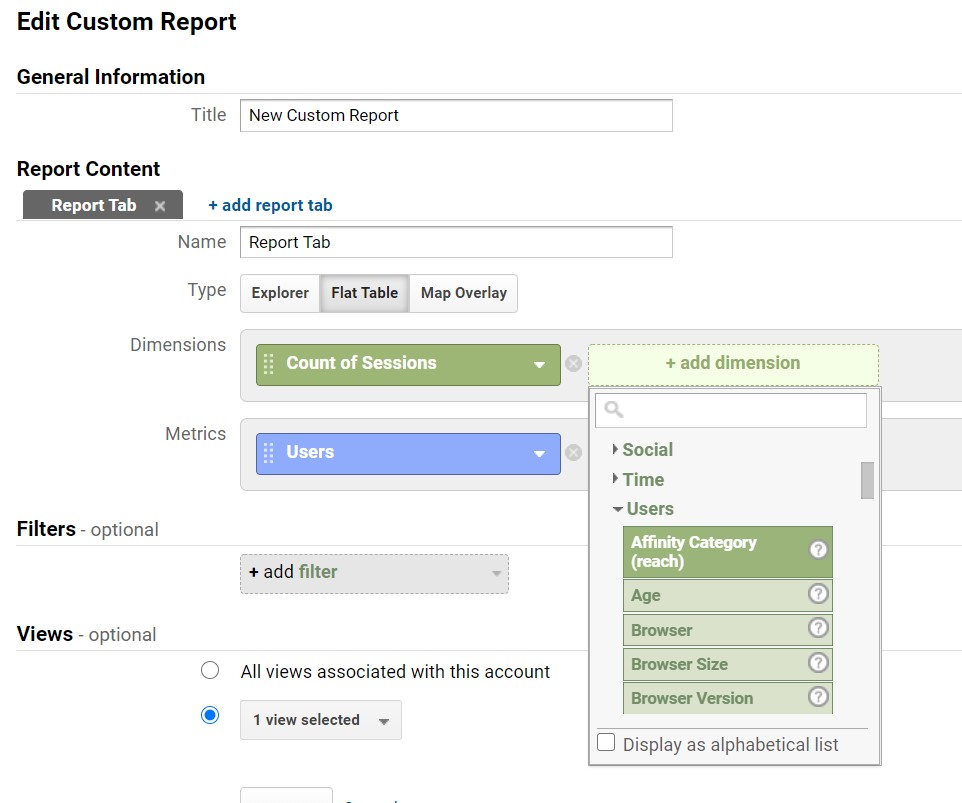
Combine these with User-scope dimensions, e.g. Country, Age or Count of Sessions. One way to find a list of User-scope dimensions is by building a Custom Report, adding a Dimension and selecting any Dimension listed under Users.
By creating custom User-scope reports, you will find more correlations between your Users’ attributes, e.g. how demographic characteristics impact the likelihood of your visitors returning to your site.
The rule of thumb when working with Metrics and Dimensions is to not mix different scopes in the same report. So, if you’re a fan of custom reports, be wary of that whenever you build a new table.
How to track Google Analytics Users across devices?

One common challenge for companies is siloed data. Different metrics live in Google Analytics and in your CRM.
Getting your multiple sources of data to speak to each other will result in richer and more accurate data. How cool is it if you can see how your top-paying customers behave on your website? And then why not relate this to their purchasing patterns and any other information that they agreed to share with you?
And if your Users visit your site using different devices and log in in both instances, the CRM-created unique identifier will enable linking them together in your Google Analytics reports under the same User (fixing the multi-device challenges I talked about earlier).
The result could be an opportunity to develop better email campaigns, extra marketing automation and personalised targeting on your own website. If you can deliver an exceptional experience to your clients, they will be happy to come back and purchase from you time and time again.
How to connect your CRM Data to Google Analytics with User ID?
However, connecting your CRM to Google Analytics isn’t a quick task. I’m not going to get too much into the technical details here (if you want that kind of guide, start with this official documentation). Instead, I’ll give you an overview of how it works.
In your CRM, you’ll need to generate a unique User ID for each client. You have to make sure that it doesn’t include any Personally Identifiable Information (PII), like an email address. Then, you’ll need to ask your developer to inject this User ID into your pages, e.g. as a data layer push.
Once this is done, capture the User ID whenever a client logs into your website. It can then be pushed to Google Analytics (you can use a tool like GTM to do it).
From that, Google Analytics creates a relationship between the User ID and the Client ID and you can start getting new insight about your customers.
Conclusion

By now you should have a better understanding of Google Analytics Users, how they’re defined and how to use User reports to analyse your traffic.
Use the insight you get to improve your website performance, conversion rates and retention.
Many of the tips in this post rely on your data to be well-configured to start with. We specialise in correct Google Analytics implementation that helps you draw actionable insights that are relevant to your business. If you’d like us to check your account for accuracy and for tracking opportunities, get in touch.


